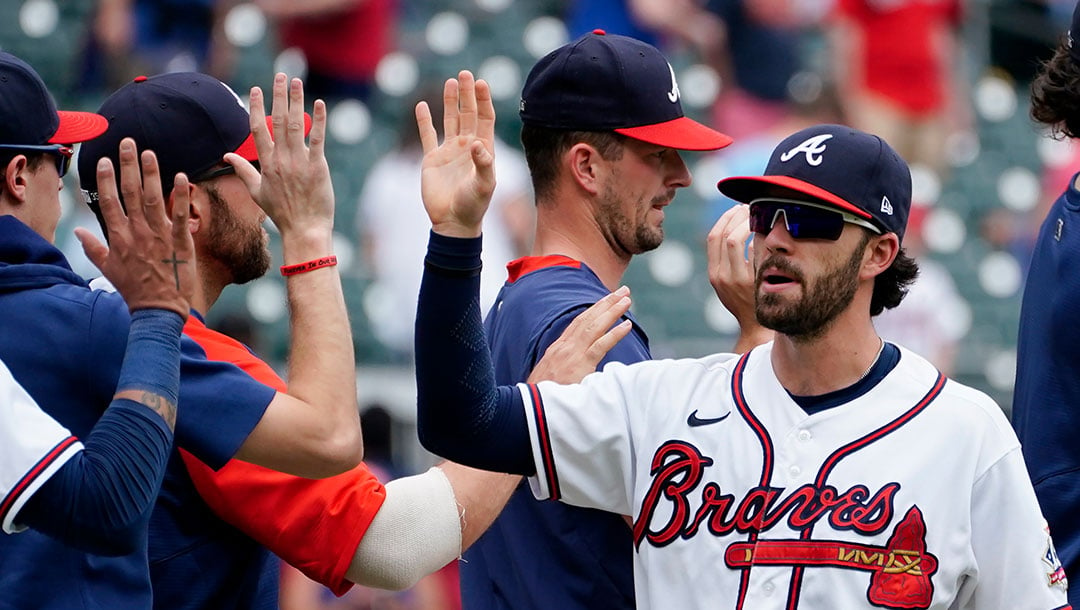
The Detroit Tigers (+155) visit CoolToday Park to take on the Atlanta Braves (-190) on Saturday, March 11, 2023. First pitch is scheduled for 1:05pm EST in North Port.
The Braves are the betting favorite in this game, with the run line sitting at -1.5 (-110).
The Tigers vs Braves Over/Under is 9.5 total runs for the game.
During Spring Training, the Tigers are 5-5 against the spread (ATS), while the Braves are 3-6 ATS.
Tigers vs. Braves Odds, Run Line, Over/Under & Moneyline
Tigers vs Braves Prediction for Today’s Game
Based on recent trends the model predicts the Braves will win Saturday‘s Spring Training matchup with 68.0% confidence.
This prediction factors in starting pitchers, recent team and player hitting performances, the last 5 games for both the Tigers and Braves and up-to-date player injuries.
Bet now on Tigers vs Braves and all games with BetMGM
Get up to $1,000 First Bet Offer
We’ve highlighted some favorite MLB player prop bets for Tigers players for Saturday‘s game, looking at profitable historical betting trends:
Best Tigers Player Prop Bets Today:
- Eric Haase has hit the RBIs Under in 5 of his last 6 away games (+2.50 Units / 16% ROI)
And here are some favorite MLB player prop bets for Braves players for Saturday‘s game, looking at profitable historical betting trends:
Best Braves Player Prop Best Bets Today:
- Travis Demeritte has hit the Runs Under in his last 5 games (+5.00 Units / 43% ROI)
- Travis Demeritte has hit the Hits Under in 5 of his last 6 games (+4.00 Units / 56% ROI)
- Travis Demeritte has hit the Total Bases Under in 4 of his last 5 games (+3.00 Units / 54% ROI)
- Travis Demeritte has hit the Singles Under in 5 of his last 6 games (+2.70 Units / 19% ROI)
Tigers Best Bets Today:
- The Detroit Tigers have hit the Game Total Under in 84 of their last 159 games (+18.10 Units / 10% ROI)
- The Detroit Tigers have hit the Team Total Over in 20 of their last 25 away games (+14.80 Units / 50% ROI)
- The Detroit Tigers have hit the 1st Five Innings (F5) Total Over in 59 of their last 108 games (+12.70 Units / 11% ROI)
- The Detroit Tigers have hit the Moneyline in 13 of their last 22 away games (+11.80 Units / 54% ROI)
- The Detroit Tigers have hit the 1st Five Innings (F5) Moneyline in 17 of their last 37 away games (+11.45 Units / 30% ROI)
Braves Best Bets Today:
- The Atlanta Braves have covered the 1st Five Innings (F5) Run Line in 86 of their last 140 games (+23.04 Units / 13% ROI)
- The Atlanta Braves have hit the Moneyline in 79 of their last 116 games (+22.00 Units / 10% ROI)
- The Atlanta Braves have hit the 1st Five Innings (F5) Moneyline in 77 of their last 133 games (+21.60 Units / 10% ROI)
- The Atlanta Braves have hit the Game Total Under in 33 of their last 53 games at home (+11.90 Units / 20% ROI)
- The Atlanta Braves have hit the Team Total Over in 37 of their last 61 games (+9.10 Units / 12% ROI)
Tigers Against the Spread (ATS) Record
Against the spread this MLB season, the Tigers have gone 4-6 against the Run Line (-1.6 Units / -13.68% ROI).
- 5-5 when betting on the Moneyline for -0.35 Units / -2.83% ROI
- 7-3 when betting on the total runs Over for +3.6 Units / 32.73% ROI
- 3-7 when betting on the total runs Under for -4.8 Units / -43.64% ROI
Braves Against the Spread (ATS) Record
Against the spread this MLB season, the Braves have gone 3-6 against the Run Line (-3.95 Units / -36.07% ROI).
- 3-4 when betting on the Moneyline for -1.35 Units / -10.8% ROI
- 5-4 when betting on the total runs Over for +0.75 Units / 7.58% ROI
- 4-5 when betting on the total runs Under for -1.4 Units / -14.07% ROI
Tigers Starting Pitcher Stats & Trends
Matt Manning allowed a slugging percentage of just .224 (15 Total Bases / 67 ABs) over the last 30 days of the regular season (3 games) — 9th best in MLB among starting pitchers with at least 13 total IP; League Avg: .401 — 94th Percentile.
Matt Manning allowed an OPS of just .440 (74 PA’s) over the last 30 days of the regular season (3 games) — 6th best in MLB among starting pitchers with at least 13 total IP; League Avg: .702 — 96th Percentile.
Opponents batted just .149 (10-for-67) against Matt Manning over the last 30 days of the regular season (3 games) — 5th best in MLB among starting pitchers with at least 13 total IP; League Avg: .242 — 97th Percentile.
Matt Manning threw at least two strikes in his first three pitches to 56% (31/55) of opposing batters over the last 30 days of the regular season (3 games) — 13th lowest in MLB among starting pitchers with at least 13 total IP; League Avg: 65% — eigh th Percentile.
Braves Starting Pitcher Stats & Trends
Charlie Morton had a first-pitch strike rate of just 58% (427/732) last season — 3rd lowest among qualified SPs in MLB; League Avg: 63% — sixth Percentile.
Right-handed hitters had a swing rate of just 45% (648/1,442) against Charlie Morton last season — tied for 2nd lowest among qualified SPs in MLB; League Avg: 50% — sixth Percentile.
Opponents have a line drive rate of 33% (63/190) against Charlie Morton with runners in scoring position since the start of the 2021 season — highest in MLB among starting pitchers with at least 161 total IP; League Avg: 24% — 0 Percentile.

